The amount of greenhouse gases emitted by generating 205 TWh (terawatt-hours) of electricity depends entirely on the energy sources used in the grid mix.
Based on global and regional emission averages, generating 205 TWh produces approximately:
- Global average grid intensity (approx. 473 g CO2/kWh): 96.97 million metric tons of CO2
- United States average grid intensity (approx. 367 g CO2/kWh): 75.23 million metric tons of CO2
- Entirely Coal power (approx. 1,000 g CO2/kWh): 205.00 million metric tons of CO2
- Entirely Natural gas (approx. 400 g CO2/kWh): 82.00 million metric tons of CO2
- Entirely Clean energy (solar, wind, nuclear, hydro): Close to 0 metric tons of CO2 during operation (negligible lifecycle greenhouse gas emissions)
Summary Comparison List:
- Coal (~1,000 g CO2 per kWh): 205.00 million metric tons of CO2e
- Global Grid Average (473 g CO2 per kWh): 96.97 million metric tons of CO2e
- Natural Gas (~400 g CO2 per kWh): 82.00 million metric tons of CO2e
- U.S. Grid Average (367 g CO2 per kWh): 75.23 million metric tons of CO2e
- Solar / Wind / Nuclear (< 15 g lifecycle CO2 per kWh): < 3 million metric tons of CO2e (here as comparison however these pose other severe environmental impacts).
According to the U.S. Environmental Protection Agency (EPA), a typical gas-powered passenger vehicle emits approximately 4.6 metric tons of CO2 per year. [1]
The equivalent number of internal combustion engine (ICE) cars that would need to be driven for an entire year to equal the emissions of generating 205 TWh of electricity depends on the power source:
Side-by-Side Equivalency Table
| Electricity Grid Sourcing | Total Electricity Emissions (Million Metric Tons CO2 | Equivalent Gas Cars on the Road for 1 Year |
|---|---|---|
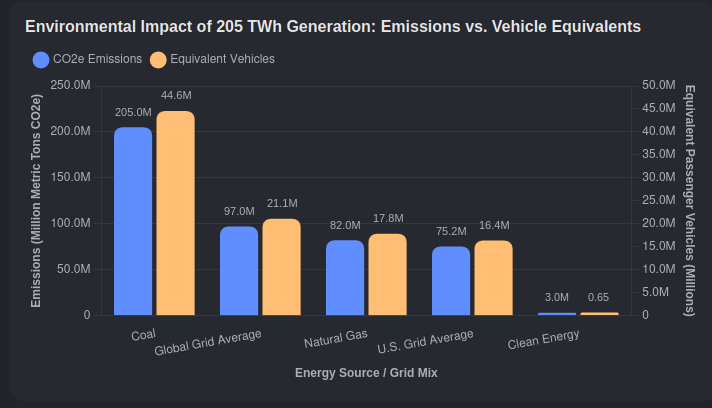
| Entirely Coal Power | 205.00 | 44.56 Million Cars |
| Global Grid Average Mix | 96.97 | 21.08 Million Cars |
| Entirely Natural Gas | 82.00 | 17.82 Million Cars |
| U.S. Grid Average Mix | 75.23 | 16.35 Million Cars |
| Clean Energy (Solar/Wind/Nuclear) | < 3.00 | Under 650,000 Cars |
Relative Scale Context
- The Coal Scenario (44.56 Million Cars): Is roughly equal to taking every single registered automobile in California and Texas combined and driving them for a full year.
- The U.S. Grid Average (16.35 Million Cars): Represents more passenger cars than are sold across the entire United States in an average calendar year.